ENV4 - CT96 - 0279
SEismic Risk evaluation through integrated use of Geographical
Information SystemS and Artificial Intelligence techniques
SERGISAI
S. Menoni, V. Petrini, G. Zonno
Istituto di Ricerca sul Rischio Sismico, Milano, Italy
with the contribution of the SERGISAI working group :
A..J. Alfaro, P. Angeletti, A. H. Barbat, J.A. Canas, P. Carrara, F. Cella, A. Cherubini, A. Di Benedetto, M. Garcia-Fernandez, M.J. Jimenez, L. Luzi, U. Mena, F. Meroni, D. Musella, F. Pergalani, L.G. Pujades, G. Ober, P. Rosset, R. Soeters, M.T.J. Terlien, R. Tomasoni, J.J. Wagner
SUMMARY
The project SERGISAI developed a computer prototype where a methodology for seismic risk assessment has been implemented. Standard codes, Geographic Information Systems and Artificial Intelligence Techniques compose the prototype, that will enable the end user to carry out a proper seismic risk assessment. Risk is expressed in terms of expected damage, given by the combination of hazard and vulnerability. Two parallel paths have been followed with respect to the hazard factor: the probabilistic and the deterministic approach. The first provides the hazard analysis based on historical data, propagation models, and known seismic sources. The deterministic approach provides the input for scenarios, by selecting a specific ground motion.
With respect to the vulnerability factor, several systems have been taken into account apart from buildings, which are usually considered in this type of analysis. Defining vulnerability as a measure of how prone is a system to be damaged in case of earthquake, an attempt has been made to move from the assessment of individual objects to the evaluation of the performance of urban and regional areas.
Another step towards an approach which can serve better civil protection and land use planning agencies has been made by adapting the analysis to the following geographical levels: local, sub-regional and regional. Both the hazard and the vulnerability factors have been treated in the most suitable way for each one, in terms of level of detail, kind of parameters and units of measure. Identifying various geographical levels of analysis is not a mere question of dimension; on the contrary entities to be studied correspond to areas defined by administrative and geographical borders. The prototype was applied in the following areas: Toscana in Italy, for the regional level, the Garfagnana area in Toscana, for the sub-regional level, and some areas in Barcelona, Spain, for the local level.
Elements and procedures to carry out a proper seismic risk assessment have been implemented in a computer architecture made of two main cores, a GIS (Arc/Info) and an Expert System shell (Nexpert), connected by a bridge. A specific interface has been designed for the prototype, to help end-users navigate among all the programs, codes and maps without having necessarily to know each one of them in detail.
1. INTRODUCTION
The SERGISAI project aims at developing a computer prototype guiding users in producing seismic risk assessment for a given area. Standard codes, Geographic Information System and Artificial Intelligence Techniques compose the prototype, which is meant to become a useful support for those whose work is to prevent risk, both in terms of civil protection and of urban and land use planning.
Experts of various disciplines, including seismologists, engineers, planners, geologists, and computer scientists, cooperated together in an actual multidisciplinary process to develop this tool. The results of the project can be interesting for society in general, by enhancing efficient and reliable civil protection planning; by encouraging knowledge sharing among experts in the seismic risk field and among the latter and urban and regional planners; by showing how it is possible to intervene on different factors, optimizing available economic and human resources by prioritizing among alternative preventive strategies. The project contributes to improve present seismic risk prevention by setting an advanced mapping methodology to produce seismic hazard and risk maps.
The method upon which the prototype was developed, following the approach first proposed by the United Nations Disaster Co-ordination Office (1), provides an estimate of risk in terms of expected damage, given by the combination of the hazard and the vulnerability of exposed systems. A first simple way to express risk is therefore the following:
Risk = Hazard * Vulnerability
In this form however, it is not so easy to recognize several induced and side effects, that are important to estimate the amount of losses not only to buildings, but also to the economy, and to other parts of the built environment, like historic patrimony, infrastructures, and other facilities, equally important for society and for its economy.
In the prototype a more complex version of the definition (see figure 1) has been therefore incorporated, which can be expressed as:
Risk = Seismic Hazard * Induced physical hazard * Systemic Vulnerability
The second term of the second factor refers to those events that might be triggered by ground shaking, like landslides (the only type of these hazards that has been actually implemented in the prototype), while the latter refers to the vulnerability of urban and regional systems, which are not considered anymore as a simple sum of the vulnerability of exposed structures, as it has been the case until now.
With the latter definition, the project introduces some new perspectives, by incorporating new elements and by treating in a new fashion others that were already considered in previous studies. First it tries to interlace parameters measuring economic, social systems as well as the built environment, with more technical factors, related to the seismic hazard, that have been always included in seismic risk analyses.
The effort that has been done was to provide end-users with a complex evaluation tool that considers both the hazard component and the response of vulnerable systems, going in the direction of overcoming more traditional approaches, where some observations on the social system were just added as an appendix to a risk assessment carried out only on a technical basis.
Figure 1. General reference framework to assess seismic risk.
Because there are so few attempts to integrate technical risk analysis with social vulnerability assessment (apart from some cases of scenarios produced in the United States, but where the damage forecast does not always derive from an actual combination of hazard and vulnerability (2, 3, 4)), the project mainly establishes a global conceptual framework, which has been almost completely defined, and some applications within the software architecture that is being developed. Models and codes that are described in this paper have been chosen to be implemented in the prototype and are meant to be used at different steps of the risk assessment procedure. There are reasons for those choices that will be explained; however, this does not mean that in the future end-users will not be free to change some codes with others they prefer or whenever new and better models become available.
The splitting of the evaluation procedure among three geographical scales, local, sub-regional and regional (see figure 2) is the second new factor that has been incorporated into the prototype. Until now in most cases seismic risk has been generally calculated as the combination of hazard and single buildings vulnerability, without changing the kind and the detail of information while considering different geographical scales. However, such a distinction would be extremely important, not only for research needs, but especially because decisions concerning risk prevention strategies as well as administrative levels involved in decision-making are not quite the same at each geographical scale.
At each scale in fact different goals are pursued: at the regional scale strategic directions for planning and risk reduction has to be made; at the sub-regional level the interaction among urban centres, transportation networks and facilities must be assessed and general location decisions must be made; at the local level single intervention has to be realized. To those different goals and subsystems a different kind of information corresponds, generally in the sense that more detailed and accurate data are required at the local level, while at the regional a rough distinction among sites with different expected damage values can be enough. Furthermore even if the latter can be obtained from a sum of very refined assessment and data, in cases where those exist, there will still be the problem of translating the point-like information into a wide, areal basis.
Figure 2. General reference framework to determine geographical scales and relative systems to be taken into account in comprehensive seismic risk assessment
One of the most frequent criticism to technical risk analyses (5), in fact, is that they do not respect administrative borders and the real powers of public officials within those borders, so that they frequently fail to integrate into the common planning and plan implementation process. The distinction among various administrative levels does not involve only officials in charge of planning and land use management activities, but also the civil protection itself, which is subdivided into regional, provincial and local offices in many European countries.
Therefore, in this project a big effort is being made in order to develop a tool addressing various levels of regional government and of management procedures. Besides, although risk is evaluated as the interaction between seismic hazard and vulnerable elements, both are specified and analyzed in different ways anytime the geographical scale changes.
2. Methodology
2.1. Definition and analysis of risk
In very general terms seismic risk is defined here as the probability of losses directly or indirectly provoked by earthquakes, losses that might be suffered either by the population or by the built up environment as well as by the economic system.
This apparently simple definition hides however some tangles, like the difference between direct and indirect damage, between losses that can be evaluated upon monetary criteria and others which cannot or should not. Ethical issues, like the question whether or not market laws should be followed to evaluate human life, are deeply involved in it.
The problem arises also when a tool for decision making has to be developed, the attempt being made in this case to provide public administrators and politicians with the largest information needed to take preventive strategies.
At present no consensus has been reached by the "disaster research" community with respect to an acceptable measure of damage, and therefore of risk. Some criticize quantitative approaches providing, for a given seismic input, estimates of damaged buildings, expressed in monetary terms, and estimates of casualties:
"The use of these studies has primarily been political. They have been used to assist the politics of earthquake-hazard mitigation and the process of consciousness raising, and they have also been used to support some of the commercial aspects of the "earthquake industry" under the new circumstances by which the earthquake problem is starting to become a recognized industry. [...] The political use of those studies being the attempt to increase earthquake awareness and hazard-mitigation activities." (3).
Although some points of this quotation are shared by the Authors, it must be also recognized that a balance must be reached between extremely complex methods, which might end up paralyzing action, and too poor analyses, that sacrifice crucial elements just to obtain quantitative results at all costs.
A multicriteria approach, that seems preferable to get such a balance, has been implicitly chosen in this project, where both probabilistic and deterministic methods of seismic evaluation are used.
The probabilistic analysis of the seismic input can be used to produce risk assessment in the broader sense, giving for each level of ground shaking severity, an expected number of victims and the amount of damage to buildings. Methods to obtain the latter have been already developed and tested in several areas adopting the damage index (expressed by a continuous function form, in the 0-100 range) approach to quantify damage to buildings stricken by a seismic event (6, 7).
From the expected damage to buildings a rough estimate of both injured and death toll can be derived, according to some simple hypotheses. With respect to the latter, for example, it may be assumed as a first approximation that collapsing houses will kill people staying inside, unless a foreschock did function as a warning. As far as an estimate of injured is concerned, different degrees of damage to buildings before collapse can be correlated to a typology of hurts according to some epidemiological data that were collected in some recent events.
In order to calculate the damage index, the following two factors must be determined:
In synthetic form the expression
can be determined, which gives the expected value of damage, for a building of given vulnerability V, for any expected earthquake. The quantity Dm(V) is the basis for the computation of different risk measures (8):
The decision to use the first, Dp, the second, D1, or the third, D, measures of damage depends on the goals set by the analysis. Dp can be used when the risk analysis is the basis
Figure 3. Curves derived from the damage-acceleration linear function, obtained from the interpolation of the Venison, Tarcento, San Daniele and Barrea data.
Figure 4. Vulnerability-damage-acceleration functions with parameters estimated on Venzone, Tarcento,
San Daniele and Barrea data.
for mitigation action that will be undertaken at random instants; D1 is more suitable when priorities must be decided for immediate actions. The definition of D as the expected value of the actual cost of the damage caused by all future earthquakes requires as an implicit assumption that after any event buildings will be returned to their pre-earthquake condition, without any reduction of their vulnerability. This measure of risk is useful when a classification of different sites has to be done, while for planning purposes the most reasonable estimate to be used, particularly at regional and sub-regional scale, consists in the expected value of the actual cost of the damage caused by the first event, D1.
The relation d(y, V) is obtained from a set of curves (see figure 3) that were identified to correlate vulnerability values and actual damage observed in buildings hit by the Friuli and the Central Italy earthquakes (1976 and 1984). This correlation has been reviewed since its first version published in 1989 (9), calibrating data coming from four centres that were extensively surveyed: Venzone, Tarcento, Barrea, and San Daniele. Those curves, shown in figure 4 (10, 11), represent the expected damage due to a given value of the ground acceleration. Different vulnerability situations move this value from one curve to another, increasing or decreasing it.
The deterministic analysis of the seismic hazard can still lead to the same kind of assessment; however, it can also be used to produce a more complete scenario, where systems others than buildings are considered, as well as links among the vulnerability of the physical and the built up environments, and the economic and social systems. Scenarios are particularly useful at the sub-regional and the local scales, enhancing a better understanding of what can actually happen (and eventually go wrong).
In order to assess those vulnerabilities a method similar to the one that was developed for evaluating structural damage to buildings has still to be designed. In the project two parallel paths have been followed: a more theoretic to enhance the modelling of complex systems and a more practical approach that has been incorporated into the prototype. Thematic maps and rule-based tools have been combined to help end-users understand what might be the chain of failures in case an earthquake of given severity occurs.
The method that has been developed for scenarios, may help overcome discussions on what should be considered as direct or indirect effect of earthquakes, by substituting the concept of chain of failures to the idea of individual losses. Some links of this chain can be expressed in monetary terms too, but others, like psychological distress or loss of the historical heritage, cannot.
Even though those elements cannot be priced in the market, as many attempts to attach them a money value showed (12), they are nevertheless very important when decisions have to be made, particularly in the European context, where the relationship between people and their historical environment is rather different than in other countries (like in the US, for example).
2.2 How the factors of the definition of risk have been assessed in the project
2.2.1. Models and codes that have been selected for hazard analysis
Hazard analysis must be performed in such a way that its output may be used to assess expected level of damage to buildings or to urban and regional systems. Many methods and codes are available to identify seismological parameters, but not all of them are equally suitable to reach the goal set above.
Among those, two models are widely used in the engineering related community: the probabilistic and the deterministic approaches. The first provides a fairly reliable forecast of what can be called "standard seismic input", that is the probability that an earthquake of given intensity will be exceeded in a given time interval, using data stored in earthquake catalogues and relying on propagation models. On the contrary the second evaluates the ground motion in a given area starting from an hypothetical source with a given strenght, according to a propagation law. To set the parameters and the propagation law a sort of geostructural model of the area must have been previously prepared. An extensive review on seismic input simulation procedures and on methods for computing soil effects was carried out in order to decide which were the most adequate for the deterministic hazard assessment approach at sub-regional and local scales (13).
2.2.1.1. Probabilistic methods for assessing the seismic input. Methods that were proposed for the probabilistic approach produce very different results, as it has been verified by several authors (14). Most of these methods assume that the seismic activity is uniformly distributed in space, according to a stationary distribution with respect to the time dimension.
Both those assumptions have been proved false, but particularly the first cannot be accepted in case of complex geological structures, where they may lead to very gross errors (15). The procedure identified by (16) seems less sensitive to errors caused by the lack of data: this is the reason why it has been preferred in this project.
This model is based on the following assumptions:
The earthquake occurrence process is represented by a renewal process expressed by the following density function:
ft(t) = p f1(t) + (1-p) f2(t)
where functions f1 and f2 are chosen in a menu including Exponential, Lognormal, Weibull and Gamma distributions; while the parameters are estimated site by site.
2.2.1.2. Deterministic methods for assessing the hazard input. With respect to the second approach, there are several possibilities ranging from more refined to very rough methods. Several simulation procedures can be used for this purpose; it has been decided to implement into the prototype the Empirical Green's Function (EFG) technique, using the EMPSYN computer code. This technique, developed according to the approach proposed by Hutchings (17, 18), allows to calculate strong ground motion time histories. The strong motion time histories are simulated by using synthetic (e.g. analytical calculations) or empirical (e.g. recordings of small events) Green's functions to constrain the propagation path through the real structure of the Earth.
Theoretical Green Functions are calculated to provide the low frequency range of the synthetic signal and its high frequency range is obtained from the recordings of small earthquakes used as EGF. The model requires a few parameters characterizing the seismic source as the moment, the fault mechanism and description, and the rupture velocity (19).
The method is well suited for events in the magnitude range 5.0-7.0 and one of its main advantages is that few number of small events are required to simulate a large one.
2.2.1.3 Models to account for local soil amplifications. In the previous two paragraphs the models chosen to determine what can be called the seismic input at the bedrock level have been explained. However, it must be remembered that soils with different lithological and morphological features respond in a completely different way to the same seismic input. Especially at a local geographical scale, therefore, local amplification due to the influence of various types of soil layers must be taken into account as well.
Existing simulation codes can be classified considering how they treat both the geometry and the behavior of the soil. 1-D, 2-D or 3-D models can be found with respect to the first factor, while linear and non-linear simulation methods were developed to describe the second.
As a first step the widely used linear-equivalent 1-D method SHAKE91 (20) has been chosen, because it is readily available, extensively tested and relatively simple to use. SHAKE91 computes the response of a semi-infinite horizontally layered soil deposit overlying a uniform half-space subjected to vertically propagating shear waves. The analysis is done in the frequency domain and for any set of properties it is a linear analysis. By means of an iterative procedure the non-linear behaviour of the soil is accounted for.
2.2.2. Models and codes that have been selected for induced physical hazard assessment: the case of landslides
As mentioned before it has been considered important in this project to address chains of failure triggered by earthquakes. The literature concerning chains of failures (21, 22) has been developed mainly with respect to technological risks, while within the domain of natural disasters a more sectorial approach generally prevailed. However, it is suggested here that the chain-of-failure-mode disaster is not linked so much to the hazard factor (either natural or technological), but, rather, to the kind of system being observed. In the present case, the "system" is urban, regional or sub-regional: undoubtedly complex, where human and natural elements are connected in a tightly coupled way (22). According to this philosophy, induced hazards are all potential sources of damage that exist per se in an area, and which might be triggered by a seismic event. In other words the earthquake increases the probability of such events to occur, worsening the expected disaster scenario. Toxic material release (23), fires, dam failures are all induced seismic hazards.
In the prototype one of the most frequent events connected with earthquakes has been considered up to now: landslides. Several codes exist to evaluate the probability of a landslide to occur under given environmental conditions; some do consider earthquakes as external triggering agent. In this case the vulnerability of a slope can be measured as the minimum acceleration needed to make the earth mass slide.
In static conditions, the simplest model of a landslide is given by a sliding plane parallel to the ground surface, referred to as infinite slope. The equilibrium condition of such a mass is given by a safety factor, Fs, indicating the ratio between the resistance of the material and the forces acting on the sliding surface (24). When the triggering cause is an earthquake, the minimum acceleration Kc that brings the safety factor to 1 should be determined. In order to do this, in pseudostatic conditions, the external horizontal force Kc*W is introduced, where W is the weight of the moving earth mass and Kc is the critical horizontal acceleration.
As far dynamic conditions are concerned, the method proposed by Newmark (25) has been chosen to calculate relative displacements induced by a given earthquake and to forecast mass stability after the event. In the Newmark’s model, the base-block interface representing the boundary surface between the landslide and the slope has a rigid-plastic behavior and the resistance of the body is expressed by the Mohr-Coulomb criterion. An accelerogram of the site of interest must be given as an input to verify if the limit resistance is exceeded; in this case, a relative displacement occurs between the base and the moving block.
A statistical approach can be followed as well. In Italy for example, several recorded accelerograms were used to assess the relative displacement of landslides differing for their geometric features and therefore for their Kc coefficient, creating a taxonomy of various types of landslides which were put into a database.
If geometric, geological and geotechnical data are available on single slopes, it is possible to carry out the analysis on single landslides. Otherwise, an areal approach can be followed, connecting available software codes with GIS systems. In this case, the seismic input is given in the form of PGA and Arias Intensity maps. When the PGA exceeds the critical acceleration, the landslide begins to move (26, 27) and the consequential displacement is calculated as a function of the Arial Intensity, Ia. The result is a map of relative displacement calculated in each single regular picture element of a raster map (pixel). The main limit of this approach is given by the lack of connectivity between single terrain units, which may lead to underestimate or on the contrary to overestimate the factor of safety.
2.2.3. Models and codes that have been selected for vulnerability assessment
A comprehensive approach to assess systemic vulnerability, especially when this term is referred to urban and regional systems, has still to be fully developed. Some attempts have been made either to identify some parameters related to urban and regional vulnerability or to evaluate some partial sub-systems, like infrastructures or special facilities. Similarly to what was done when buildings vulnerability was studied for the first time, two approaches were proposed to be pursued in the project, in order to develop this field of research also from a theoretical point of view. Those are the vulnerability matrix and the vulnerability index approach.
The first aims at extracting patterns of potential failures from information of damage and losses suffered in past events. Detailed information regarding the Irpinia and the Central Italy earthquakes (1980 and 1984) were extensively analyzed.
The vulnerability index approach, instead, tries first to structure the modelling of systemic vulnerability, using existing literature and past earthquake experiences. Available data are then used to calibrate the qualitative functions that can be produced.
The procedure that was followed aimed at:
Parameters to measure urban and regional vulnerability are not so homogeneous as it might be the case for other systems, because many social, economic factors as well as elements related to the built environment must be forcely taken into account.
Furthermore, both time and spatial dimensions have to be considered: with respect to the first, it is almost impossible to limit the analysis to the seismic impact, as the response to the earthquake at the emergency and during the reconstruction is equally prominent, especially when preventive measures have to be foreseen.
In very general terms it can be argued that at the impact most of the physical damage occurs, provoked by the earthquake or by induced hazards, and affecting physical objects and people, whereas in the emergency both induced damage and systemic damage may hinder search and rescue activities. During reconstruction some physical damage and some systemic damage will not be fixed, or will be fixed in such a way that a part of the stricken area and of its inhabitants will suffer permanent losses (human as well as economical). It is possible to refer to the latter as to damage in the long run, that will persist after the period of time needed for recovery and reconstruction.
A first framework has been therefore developed to address those observations as much as possible. The framework gives a synthetic picture (see figure 7) of the most important entities which are part of urban and regional systems and which might be affected by the hazard. The framework (shown above) is organized in the following way: starting from the assessment of the vulnerability of single objects to physical damage (second column), we go through induced hazards (third column) to the vulnerability to physical induced hazards (fourth column) to the assessment of the subsystem vulnerability (fifth column).
In the latter single objects are put in a geographical and spatial context, allowing to assess the systemic damage which occurs when the system is not able anymore to fulfill its task.
Figure 7. Part of the framework to see links of systemic vulnerability
The relation among systems is given by the letters and numbers which appear above some of the boxes (for example the sub-system of services dealing with emergency management, in line 3, depends also on what happens to access ways, line 2, and to lifelines, line 1).
2.2.3.1. Method to assess the vulnerability of buildings. A sub-system which has already been studied by previous research and tested over more than ten years refers to buildings and particularly to residential buildings (28).
The vulnerability index approach that has been chosen for the prototype, is based on factors analysis. Eleven parameters related to components as well as to qualitative features have been identified as crucial to assess how prone is a building to be damaged by ground shaking. Each parameter is given a score, according to four classes ranging from poor to good conditions (D to A), while the overall vulnerability index is given by:
V = Si pi wi
where: pi is the score of the index parameter;
wi is the weight measuring how important is each parameter with respect to the others.
The final score can range from 0, when present building codes requirements are met to 100, in case of very vulnerable structures (table 1).
|
i |
Parameter |
Classes ( pi ) |
wi |
|||
|
|
|
A |
B |
C |
D |
|
|
1 |
Resistance system organization |
0 |
0 |
20 |
45 |
0.261 |
|
2 |
Resistance system quality |
0 |
5 |
25 |
45 |
0.065 |
|
3 |
Conventional resistance |
0 |
5 |
25 |
45 |
0.392 |
|
4 |
Position of the building and foundations |
0 |
5 |
25 |
45 |
0.196 |
|
5 |
Diaphragms |
0 |
5 |
15 |
45 |
var. |
|
6 |
Plan configuration |
0 |
5 |
25 |
45 |
0.131 |
|
7 |
Elevation configuration |
0 |
5 |
25 |
45 |
var. |
|
8 |
Maximum distance between walls |
0 |
5 |
25 |
45 |
0.065 |
|
9 |
Roof type |
0 |
15 |
25 |
45 |
var. |
|
10 |
Nonstructural elements |
0 |
0 |
25 |
45 |
0.065 |
|
11 |
Preservation state |
0 |
5 |
25 |
45 |
0.261 |
Table 1. Numerical scale of vulnerability index V (25). The weight of the parameters 5, 7 and 9 varies in a range comprised in 0.131 - 0.261; depending on some elements like: the percentage of rigid well connected diaphragms, the presence of open gallery floors, and the roof weight.
2.2.3.2. Developing a model to assess the vulnerability of urban systems. Another sub-system which has been analyzed in this project concerns the health care system, chosen because it is a crucial component in emergency management and because it is deeply interlaced with several other systems. Furthermore it seemed a meaningful extension of surveys and studies that had already been done on hospitals considered as built structures (that is according to the method described in the previous paragraph). It was therefore decided to try shifting from this object oriented to a more systemic approach.
In order to analyze the function of the health care system it has been decided to introduce a simple scheme (shown in figure 8) representing spatial and functional relations between hospitals and the stricken area.
The first may be within the latter or outside it, at a distance that has been decided in an hour drive. Hospitals are made of physical structures and machinery and of personnel. Physical structures and machinery need a minimum level of services provided by external plants to carry out their normal activity; personnel has to be able to reach hospitals from stricken areas, while injured people must be transported to centers providing health care.
This simple scheme illustrates the idea according to which it is almost useless to limit the analysis only to the physical features of hospital buildings: on the contrary the analysis must cover several geographical scales in order to assess which is the portion of the region that is potentially affected by the disruption of that particular hospital and how the disruption in connected services and other systems determine its ability to function.
As far as the single hospital is considered, some parameters have been identified to assess the following:
It has been proposed to measure the direct damage provoked by the earthquake to the hospital and particularly to those wards essential to cure injuries which are more frequent in this case (29) in number of lost beds.
The second step is to move to the outside and to evaluate how important is for an entire area the loss of a number of beds in a single hospital; in order to do this, other health facilities in the area and in the periphery of the epicenter must be taken into account, as well as their overall organizational vulnerability, due to the lack of coordination among hospitals and with other civil protection agencies. In fact the ability to sort injured people among various hospitals is the result of several previous correct assessments regarding:
Figure 8. Method to perform the assessment on each hospital in the selected area.
The assessment of the comprehensive damage to the health care system through the parameters that have been identified above allows to address mitigation strategies along various directions, not limiting the attention only to the physical consolidation of a single hospital, which might prove impossible to reach or to use for reasons determined by connected urban systems.
2.3. Definition of the prototype
2.3.1. Logic definition of the prototype
The prototype allows users to carry out a complete risk assessment, selecting data stored in databases and procedures that have been shown in the chapter describing the methodology. As one of the most interesting feature of the latter consists of the distinction among geographical scales, the user is guided in his assessment process through three paths, according to his wish to run the system at a local, sub-regional or regional level.
At the various scales the most adequate codes, databases and models should be used; this would mean that at any scale all the operations that would make sense should be allowed, while those which would not, should be discouraged. Because this is a prototype, partially linked to the possibility of testing various steps of this definition on the areas that were selected, this general rule was not followed so rigidly, especially with respect to what might be done but is not present yet at each level of the computer architecture. For example the deterministic and the probabilistic approaches for the hazard analysis were not both implemented at the three scales (it has not at the local), as the induced hazard represented by landslides was considered only at the sub-regional scale, while it should in any case where the landslides problem exists.
With respect to the regional scale (see figure 9), public administrations need mainly maps showing those areas where the highest degree of damage is expected in case of earthquake. Municipalities are the unit of study that has been considered consistent with this scale.
Figure 9. Framework to assess seismic risk at regional scale.
As far as the hazard factor is concerned, the prototype allows for both the probabilistic and the deterministic approaches.
Regarding the vulnerability factor, only the assessment on existing buildings can be carried out using "poor data" provided by national census. The final result is in this case a map showing settlements prone to different levels of risk on a statistical basis. Therefore, values of risk given to the various settlements should not be considered per se but only within a general frame to facilitate the following assessment:
At the sub-regional scale, it is necessary to determine how the global system will face the earthquake and how and if it will be able to overcome the crisis in its immediate aftermath. Therefore the analysis should not be limited to the performance of single buildings, but should take into account also the behavior of the economic system, of infrastructures, of public facilities and of society in general.
Figure 10. Framework to assess seismic risk at sub-regional scale.
As it is clearly shown in figure 10, at the sub-regional scale what must be understood is the overall function of various systems interacting together and how this interaction may increase or decrease risk to people and to artifacts. In this case not only the physical damage expected to buildings must be assessed, but the systemic damage, due to the bad function of the built environment considered as a whole, should be estimated as well. The assessment process should overcome the phase of the impact in order to forecast also what will happen also during the emergency and the reconstruction, as it has been suggested by experts at "soft" disciplines (30, 31, 32). What happens during the emergency and the reconstruction is not strictly determined by physical damage, it depends also on other factors (social, economical, geographical), which must be studied at this scale.
It must be underlined that the sub-regional scale is not a mere question of dimension; on the contrary entities to be studied should correspond to areas defined by administrative and geographical borders and characterized by homogeneous features.
With respect to the hazard both the deterministic and the probabilistic approach can be followed at this scale too.
At this scale also the vulnerability of the physical environment (that is the probability of landslides) can be calculated. Landslides represent induced natural hazard that might affect the same areas already stricken by seismic shakes or provoke damage to undamaged structures.
Looking at the vulnerability factor, not only buildings are taken into account, but also parameters referring to the social, the economic, and the built systems.
Figure 11. Framework to assess seismic risk at local scale
The final result consists of risk maps in the case of the probabilistic approach, compounding the risk to urban settlements, to infrastructures and access ways as well as to social and economic systems.
At the local scale (see figure 11) not only risk maps and scenarios must be more detailed than at the previous scales, they also have to be verified with punctual and precise direct surveys.
While at the previous two scales, it is possible to apply statistical and sampling techniques, at the local scale the forecast of expected losses should be as much closer to reality as possible, because it provides the actual basis for specific mitigation interventions. In other words, at the regional and sub-regional scales it is mainly a matter of prioritizing actions, not only among different zones, but also among different systems and sub-systems (deciding for example, to favor actions on strategic public buildings and on access ways rather than on private dwellings). At the local level, instead, policies have been already selected and they must be put into reality on the basis of accurate maps and scenarios.
With respect to the hazard, it is compulsory therefore to study also local geological effects, which have been recognized as the main factor explaining different behavior of similar buildings hit by the same earthquake.
As far as the vulnerability factor is concerned, the expected behavior of existing buildings as well as some parameters related to infrastructures, and to social and economic environments should be assessed.
2.3.2. Hardware and software main features
According to the original design the prototype should have been made of two main parts: the
Expert System and the GIS, connected by a bridge (see figure 12). In the GIS existing software and codes to assess hazard and vulnerability functions should have been implemented, while the expert system should have allow to carry out more complex evaluations regarding those systems where a rule-based-structure assessment seems preferable. Those two components should have been interfaced in a friendly way to enable non-expert users to carry out the most important steps of the seismic risk analysis process.
Inside the structure shown above, the selected modules for risk analysis should have been evaluated case by case in order to decide whether to implement them directly by AML language (the language to create Arc/Info macros) or to use them in their original language as external modules. In fact the problem was twofold: sometimes the translation was very time-consuming, some codes could not be translated at all into the GIS, or when they could, the resulting computational performance would have diminished dramatically if compared to the "outside feeding" code solution. Besides, the resulting structure would have been extremely rigid and would not have permitted any change of implemented codes.
Some functions of the GIS are used and managed by the expert system (as for example the network analysis which is required to assess accessibility to stricken areas and to strategic public facilities).
All the codes and software written in traditional languages were connected to the GIS, from which spatial data can be taken to implement computations, the results of which can be mapped in their turn in the GIS.
As the diagram representing procedure work flow is a highly connected graph, the working environment has been designed following a browsing oriented approach (in a fashion which is derived from Internet browsers, figure 13), to support users' orientation and navigation in the complex structure of the overall elaboration process.
Within the environment, both process units and data are viewed as nodes, thus obtaining a computational application (in the so called display-oriented applications nodes are not executable). Nodes are connected in a complex net in which links represent either functional activation sequences (if there exists a link from node A to node B, and both nodes represent module front-ends, then node A must be activated prior to node B so that results of A may be used by B), or data connections to a module node (if there is a link of node D, representing data, with the above node A, D represents input/parameter files used to activate A, or output files produced by it). By clicking on a node representing a module, the user gets access to its front-end; by clicking on a node representing data, he causes the display of the list of represented files (if available).
Figure 12. Expert System & GIS: Rule-based reasoning applied to spatial
data and to seismic risk modules.
Besides the browsing spaces (one for looking at the context, one for zooming in a part of the net), and a space to display file information, the environment contains also:
The environment is able to store, for each result, the chain of functional modules executed to obtain it and the files used by each module. This information is particularly important as the prototype must be used as a decision support tool.
Figure 13. An example of the software prototype front-end
3. APPLICATION OF THE PROTOTYPE TO THE TEST AREAS
The prototype was applied to three test areas, ranging from a region to a part of a town. The application was necessary not only to verify the function of the prototype, but also to calibrate and improve it, by showing which database and which procedures were mandatory to run it effectively and to produce meaningful results.
Further applications will probably enhance the prototype, especially given the fact that the three areas that were selected are not strictly one inside the other, as it would have been preferable to qualify the "three geographical scales procedure". In fact, for the regional scale the Toscana area in Italy was chosen, for the sub-regional scale the Garfagnana area, which is part of Toscana, while the local scale was developed in Barcelona.
The reason is to be found in the way the project has been redesigned. Originally, in fact, the three geographical scales should have been fully developed both in Italy and in Spain; furthermore both the deterministic and the probabilistic approaches should have been implemented at any level.
However, when final funding and time were granted, the project had to be re-designed and it was decided to test the prototype in the three mentioned areas and to apply only the deterministic method at the local scale.
Figure 14. Probability density functions of the vulnerability index for Toscana region.
(Vulnerability class: masonry buildings, 1-2 floors, high level of maintenance)
3.1 Application at the regional scale in Toscana
Risk maps and scenarios were produced evaluating the hazard input through the probabilistic method to obtain the first and the deterministic approach for the latter. The vulnerability assessment was carried out on residential buildings adopting a statistical approach that has been developed for this purpose.
In fact, even though the method for evaluating single buildings vulnerability is quite well defined, it cannot be applied to large areas, not only because it would cost too much in money and time to survey each building, but also because the result would be useless at this scale, where the information needed for decision making is less detailed.
Census data are a primary source in this case: they cover homogeneously the whole country though the information they provide permits only to estimate the total number of buildings, the total volume and a poor classification in terms of age and few typological parameter (the material, the level of maintenance, the number of floors and the structural context).
Figure 15. Probability density functions of the vulnerability index for Garfagnana area.
(Vulnerability class: masonry buildings, 1-2 floors, high level of maintenance)
The approach (33) considered in this project is organized in the following steps:
Each curve represented in figures 13 and 14 is in fact the probability density function of the vulnerability index for those typological classes of buildings that were obtained. When there are enough data, the distribution can be calculated on a site by site basis; otherwise other areas similar for buildings typology must be considered, or the mean obtained on a national or large-areas basis must be chosen as a reference.
Figures 14 and 15 show differences on the estimates produced in Toscana and in the Garfagnana area.
In Italy (figure 16) data have been surveyed by the GNDT since the Parma earthquake in 1983, upgrading them with information acquired on public buildings (34).
Figure 16. Municipalities locations of performed vulnerability survey.
3.2. The sub-regional level
Two kinds of risk maps have been produced at the sub-regional level of Garfagana. Probabilistic risk maps represent expected damage to buildings in the area taking into account the seismic hazard, the induced physical hazard of landslides and the vulnerability of residential buildings and of public facilities.
Residential buildings vulnerability has been assessed adopting a mixed sampling-statistical method. Some settlements (Minucciano, San Romano, Castelnuovo and Piazza al Serchio) were extensively surveyed in previous field work, while for the other settlements a statistical approach was followed, calibrating the parameters with data available from those test areas.
Figure 17. Available landslides map of Garfagnana area.
earthquake. First it will be possible to appreciate how landslides might block primary access ways, and how the health care system would perform in the first hours after the event.
As far as landslides are concerned information on more than 1300 mass movements was available since previous surveys have been carried out in other recent research (see figure 17). After having run the code to calculate slope stability, results are given in terms of expected displacement of those landslides that can be actually triggered by an earthquake with a predetermined value of PGA.
On some slopes, where data were geometric, geological and geotechnical data were available at a greater level of detail and accuracy, a single slope analysis has been carried out (35). Within this second level of analysis, also groundwater conditions were accounted for more accurately, after extensive surveys and mathematical modeling.
The first chain of failure is therefore complete, by forecasting how an earthquake of given severity might trigger landslides, collapsing on settlements or on lifelines (or carrying both down with them).
Another chain of failure was considered with respect to the function of health care system, according to the method described in paragraph 2.2.3.2.
In figure 18 a first attempt to assess the vulnerability of the health care system, combining different kinds of information is shown: using the GIS function Network analysis it was possible to estimate the time needed for injured to be taken to the closest hospital in Garfagnana. Four facilities were considered: the ambulatory in Piazza al Serchio, in the northern part of the Garfagnana, and the three hospitals in Castelnuovo Garfagnana, in Barga, and in Lucca (the last two outside the area under investigation).
3.3. Local scale: Barcelona city
As it was mentioned above, at the local scale, in Barcelona city, all the attention was focused on the production of scenarios. The hazard has been obtained adopting the Empirical Green Function technique to determine the seismic input and calculating amplifications due to local geological soil conditions. Therefore the vulnerability of the part of the town called Eixample has been assessed to estimate expected levels of damage in various urban blocks.
The lack of acceleration records within Barcelona city and the need for characterizing ground motion in terms of both amplitude and frequencies makes it necessary to obtain seismic input scenarios using available digital short-period seismic recordings obtained in on-rock-outcrop stations close to Barcelona. The most active seismic source zones which could generate an earthquake affecting Barcelona city have been identified from available tectonic, seismicity and earthquake data together with results obtained in previous earthquake hazard assessment for the region. The source areas of interest in this case are the Pyrenees and the Catalan Coastal Ranges, including offshore seismicity .
Figure 18. Allocation of the Garfagnana area roads at different hospitals.
Figure 19. Example of calibration of the Empirical Green’s Function (EGF) model (program modified from L. Hutchings, LLNL, California). Comparison between recorded seismogram and synthesized one. One aftershock recorded at VAN station (M=2.8) is used as EGF to synthesize the main shock (M=4.2) 65 Km SW far from Barcelona. The seismic source (40.94°N, 1.56°E and 8 Km deep) is an inverse strike slip fault mechanism (azimut of 260°, dip of 54° and slip of 60°). The calibration phase of the model is the first step of numerical simulation to improve seismic scenarios.
The EGF-technique was applied to simulate moderate events (5.0 to 6.0 magnitudes) which can be reasonably expected to strike the city. Recordings of the aftershocks of three recent earthquakes which occurred in 1987, 1991, and 1995 have been used to compute seismic input scenarios at the bedrock level (see figure 19).
A second step of the seismic hazard analysis requires to account for local soil effects, using synthetic records provided by the EGF-technique as input motion. Detailed information on soil characteristics in Barcelona city needed for 2 or 3-D soil response modelling is lacking: a general geotechnical map (1:25,000) by LOSAN (36), together with very few shallow-borehole data, is all that can be used. Therefore, to compute the seismic response of the soil columns, the linear equivalent 1-D method SHAKE91 (20) was implemented in the prototype.
Furthermore, in order to improve information regarding the depth of soil deposits in the area, several field surveys on ambient noise measurements were carried out in 70 sites (acceleration) and 150 sites (velocity) selected all over the city (see figure 20). Predominant periods of selected soil columns can be obtained adopting the empirical approach developed by Nakamura (37), using the spectral ratio of the horizontal to vertical components.
The final result of the deterministic hazard combined with local amplifications analysis is provided in a map of PGA values expected at various sites in Barcelona city. This map is used to produce risk maps, that is the expected damage scenario in buildings with different vulnerability. To assess the latter the vulnerability index approach was adopted.
Unfortunately, there are not enough data on pre-earthquake conditions and post-earthquake surveys to calibrate the method developed in Italy in the Spanish region.
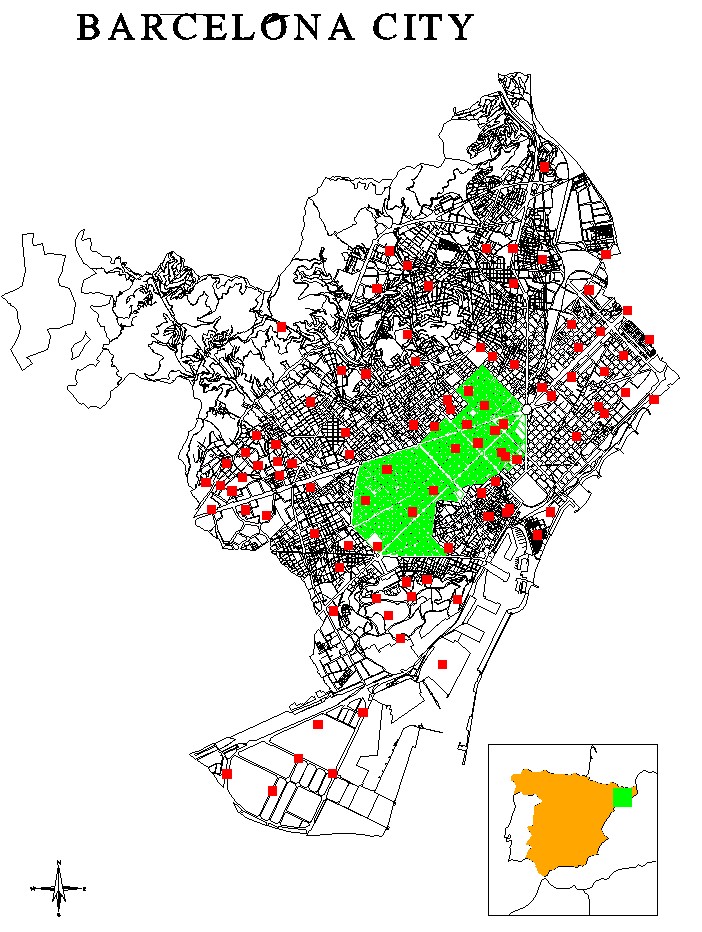
Figure 20. Barcelona city: map of noise measurement points and Eixample district (in green).
A post-earthquake study was performed after two crustal seismic events which occurred in the Almería region, in Southern Spain, on December 1993 and on January 1994. The study began by surveying the damage to several masonry and concrete structures. The type and extent ofthe damage were analyzed and classified for each structural and non-structural part of damaged building and correlated with the damage index defined by the vulnerability index method (38). The survey of structures damaged in the Almería region provided only one vulnerability function, corresponding to the intensity VII MSK assigned to the earthquake in that region.
This study represents the only Spanish reference for vulnerability assessments in Barcelona, where only masonry structures have been considered. Those structures are in the part of Barcelona that has been built since the Plan of the Catalan architect Cerda’ in the last century, called the Eixample- meaning in Catalan the "expansion", "new development" of the city. In this part a block has been surveyed building by building, allowing for data and values calibration (39, 40). Secondly a statistical approach was followed, extending the vulnerability assessment to the rest of the Eixample, using the information provided by the City Council (Ayuntamiento), in the form of digitized maps (see figure 21). Four of the eleven parameters needed to apply the vulnerability index approach, namely the conventional resistance, the position of the building and its foundation, plant and elevation configuration can be directly derived from those maps. The others were derived by calibrating data obtained in the test area.
In order to calculate the expected value of damage in this area, the correlation damage-vulnerability that has been explained in the 2.1 paragraph will be used.
4. how the prototype can be used in a decision making process
The methodology that has been implemented in the prototype, makes it much closer to a decision support tool rather than to a set of independent codes giving certain outputs.
In fact, while some codes could be changed within the architecture of the prototype without violating its rules, the philosophy upon which it has been built should be maintained. It is in fact an oriented approach towards seismic risk assessment, addressing all the elements that should be taken into account to leave open the largest number of alternative mitigation and preventive strategies.
Several parts and methodological choices incorporated in the prototype make evident this point.
First the vulnerability component of the definition of risk, which is used not only for buildings, but in a more comprehensive way, to include also some urban and regional functions. Because of the novelty of the approach and because of the limits of time forwarded to the project, not all the systems that should be important to investigate were developed. However, the idea that they can be incorporated in such a tool has proved to work and open new directions for future research.
The reason for analyzing in such a detail vulnerability factors for single elements and for social and economic systems lies in its importance in any country where old settlements exist, like it is the case in all the Mediterranean Basin.
While traditional seismic engineering studies have been focusing for long time on rules and codes for new buildings, it must be underlined that the main problem in all Mediterranean countries concerns hundreds of settled towns, with their infrastructures (in good or poor
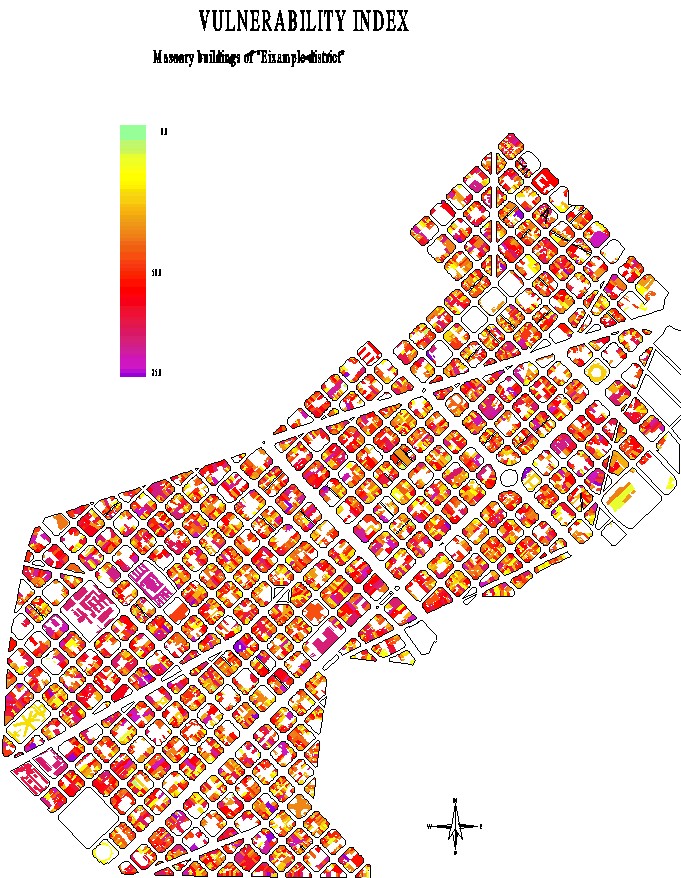
Figure 21. Vulnerability map of Eixample district (Barcelona city).
maintenance conditions) and their traditional houses (some of which are part of the historical and monumental heritage).
Secondly, if the vulnerability assessment involves not only physical elements, but also systemic links, organizational factors, and it covers besides the moment of the actual impact of the earthquake also the emergency and the reconstruction, it is easier to articulate prevention policies according to available budgets and resources. In order to reduce expected losses of the disaster, it is possible to take action regarding various systems improving their performance at different phases. Various alternative options can be weighed one against the other by decision-makers. For example in the case that was illustrated regarding the vulnerability of the health care system, options like consolidating those hospital buildings which are more vulnerable or instead improving access networks to more resistant hospitals can be compared and an agreement can be reached with respect to which is preferable to ease emergency operations, or simply considering available budgets.
Another example is provided by the vulnerability assessment on residential buildings. A computer code to carry out cost-benefit analysis will be incorporated in the prototype, allowing end-users to compare the cost of reconstruction or of repair of damaged houses in case of earthquake, with the cost of preventive consolidation. This comparison can be even more detailed , by showing differences among actions taken on various combinations of the eleven parameters forming the vulnerability index.
Last but not least, the ability to make seismic risk analyses correspond to different geographical scales might help administrations and decision makers combine preventive measures with other policies, like for example combine environmental restrictions with seismic codes or taking into account local geological effects when new roads or infrastructures must be designed.
Who is the end user of the prototype is an important question to be answered, whenever a tool to be used by public administrations is designed.
Over the last months of the project, it has been reached the conclusion that it is impossible to think of a unique user, not only because of the practical difficulties in creating such a "machine", but also because perhaps it is even useless. In fact seismic risk assessment and analyses require many experts of various fields to cooperate together, not only for interpreting the results, but also for providing necessary data in the right format. Furthermore those who will carry out the assessment (or part of it) will not be the same who make decisions.
The answer to the previous question is therefore that a multidisciplinary complex end user has to be identified, as both experts of various fields involved in seismic risk assessment and decision makers should use together this tool to test first the actual risk and then the risk reduction resulting from actions on several parameters according to alternative preventive strategies.
Although it might seem surprising that scientific and technical experts will work together with decision-makers, it is the best solution according to those who analyze difficulties and misunderstandings arising from the lack of mutual understanding between scientists and politicians (41, 42).
5. SOME PRELIMINARY CONCLUSIONS
An ideal prototype should allow end-users to carry out a complete risk assessment and evaluation of preventive strategies communicating through a friendly user interface. The risk assessment should address not only all the parameters defining the hazard but also give a complete picture of the vulnerability of the most important sub-systems that are part of the life of human settlements.
This goal still requires a lot of thinking and work. The project that has been presented in its main features is a first attempt to integrate tools, codes, methods for assessing the expected damage which have been originally developed separately one from the other. Apart from this attempt to put everything in a unique system, which is conceptual before being material (the computer prototype), new areas of investigation or new approaches to traditional areas have been searched. Not everything has been put into the prototype, however the framework that has been developed can be used in the future as a reference to complete the assessment tool.
Other directions for research can be explored starting from what has been done until now. Some of them consists of an improvement of the links among various codes which provide results for seismic and induced hazard analyses, for vulnerability assessment, and for expected damage estimates. Each of those fields could be further developed: however it is felt by the Authors that a better interface (which is not a mere technical matter) among them is perhaps more important at the present state of art than refinements that can be done in anyone of them.
Other areas of investigation deserve more attention than they have been granted until now, especially with respect to what has been referred to as systemic vulnerability.
On the ground of the experience gained with this project, it can be suggested that to achieve the last two goals more attention will have to be put on achieving real interaction among scientists of various fields as well as between the scientists’ community and the end-users of their research, that is public administrators and decision makers.
ACKNOWLEDGMENTS
The Authors and the SERGISAI working group acknowledge the European Commission, Directorate General XII for Science, Research and Development under the Environment and Climate Progamme (1994-1998), Climatology and Natural Hazards, for having funded and supported this research.
They wish to thank as well those public administrations who forwarded the project in various way and namely: the Laboratory of Geophysical Studies "Eduard Fontsere" of the Institut d’Estudis Catalans, the Geographical Survey of Catalonia, the Ajuntament de Barcelona, and the U.O.C. Rischio Sismico del Dipartimento Ambiente della Regione Toscana.
REFERENCES:
(1) A.a.V.v. (1979). "Natural disasters and vulnerability analysis". Report of expert group, Rep. Undro (United Nations Disaster Relief Co-ordinator), July, 1979.
(2) EERI (1996). "Scenario for a magnitude 7.0 earthquake on the Hayward Fault", California.
(3) EGOUCHI et al. (1990). "The economic consequences of catastrophic earthquakes", Proceedings of a Forum of the United States Geological Service, National Academy Press, Washington D.C.
(4) PANEL on Earthquake Loss Estimation Methodology (1989). "Estimating Losses from future earthquakes", National Academy Press, Washington, D.C.
(5) STALLINGS R. (1995). "Promoting Risk. Contructiong the earthquake threat", Aldine de Guyter, New York.
(6) ANGELETTI P. (1984). "Un modello per la valutazione dei costi di riparazione e adeguamento antisismico sulla base dei censimenti di danno e vulnerabilità". Atti del seminario sul tema: "Vulnerabilità e metodi per la riduzione del rischio sismico, A cura di Corrado Latina. Noto (Sicilia).
(7) ANGELETTI P., BELLINA A., GUAGENTI E., MORETTI A., PETRINI V. (1988). "Comparison between vulnerability assessment and damage index, some results", Proceedings of the 9th World Conference on Earthquake Engineering, Tokyo-Kyoto, volume 8 - pp.181-186.
(8) GUAGENTI E., PETRINI V., DREI A. (1988). "Rischio Sismico Locale in Ipotesi Non-poissoniana: Confronto tra Siti", AIMETA 88, Bari: 663-666.
(9) GUAGENTI E., PETRINI V., (1989). "Il caso delle vecchie costruzioni: verso una nuova legge danni-intensità", Proceedings of the 4th Italian National Conference on Earthquake Engineering, - Milan - (Italy), volume I, pp. 145-153.
(10) MERONI F., TOMASONI R., GRIMAZ S., PETRINI V., ZONNO G., CELLA F. (1995). "Assessment of seismic effective vulnerability using Arc/Info connected to Nexpert", Proceedings of the Fifth International Conference on Seismic Zonation - Nice - France, October 17th - 19th, 1995, volume I, pp. 68-75.
(11) GRIMAZ S., MERONI F., PETRINI V., TOMASONI R., ZONNO G., (1997). "Il ruolo dei dati di danneggiamento del terremoto del Friuli, nello studio di modelli di vulnerabilità sismica degli edifici in muratura", La Scienza e i Terremoti - Analisi e prospettive dall’esperienza del Friuli - 1976/1996, 14-16 novembre 1996, Udine.
(12) COCHRANE H., (1993). "La valutazione dei danni dovuti a disastri naturali e procurati dall’uomo", in L.F. Girard, ed., "Estimo ed economia ambientale: le nuove frontiere nel campo della valutazione. Studi in onore di Carlo Forte", Franco Angeli Publisher, Milan.
(13) SERGISAI Working Group (1997) - European Commission Directorate General XII for Science, Research and Development "First Year Progress Report of the SERGISAI Project " Environment and Climate 1994-1998 - Climatology and Natural Hazards - March 1997.
(14) MAYER-ROSA D., SCHENK V. (1989). "TERESA, Journal of the Int. Soc. for the Prevention and Mitigation of natural Hazard", Special Issue.
(15) GRANDORI G., GARAVAGLIA E., PETRINI V. (1991). "Analysis of Some of the Uncertainties in the Statistical Elaboration of Historical Data for Local Seismic Hazard Evaluation", Proc. 6th International Conf. on Application of Statistic and Probability in Civil Engineering, Mexico City.
(16) GRANDORI G., GUAGENTI E., PETRINI V. (1984). "On the Use of Renewal Processes in Seismic Hazard Analysis", Proc. 8th World Conf. on Earthquake Engineering, 1, San Francisco: 287-294.
(17) HUTCHINGS L., (1991). "Prediction of strong ground motion for the 1989 Loma Prieta earthquake using empirical Green’s functions". Bull. Seism. Soc. Am. 81, pp 1813-1837.
(18) HUTCHINGS L., (1994). "Kinematic Earthquake Models and Synthesized ground Motion Using Empirical Green’s Functions". Bull. Seism. Soc. Am. 84, pp 1028-1050.
(19) JARPE S.P., KASAMEYER, (1996). "Validation of a procedure for calculating strong-motion time histories with empirical Green's functions", BSSA, volume 86, n. 4, pp. 1116-1129.
(20) IDRISS I.M., and SUN J.I., (1992). "User's manual for SHAKE91: A computer program for conducting equivalent linear seismic response analysis of horizontally layered soil deposits" Dept. of Civil & Environmental Engineering, Univ. of California, Davis.
(21) TURNER B., (1978). "Man made disasters", Wykeham Publisher, London.
(22) PERROW CH., (1984). "Normal accidents. Living with high risk technologies", Basic Books, New York.
(23) LINDELL M. and PERRY R., (1997). "Hazardous materials releases in the Northridge earthquake: implication for seismic risl assessmen", in "Risk Analysis", Vol 17 n.2, April 1997.
(24) GRAHAM J. (1984). "Methods of stability analysis", in Slope instability, D. Brunsen and D. B. Prior eds, Wley & Sons, New York, pp. 523-602.
(25) NEWMARK N. M. (1965). "Effects of earthquakes on dams and embankements", Geotechnique, vol. 23, pp. 139-160.
(26) LUZI L. and PERGALANI F. (1994). "Analisi di stabilità di situazioni tipo connesse con fenomeni franosi in condizioni statiche e dinamiche di un'area campione (Foglio Fabriano Appennino Umbro-Marchigiano)", Ingegneria Sismica, anno XI, 2; 1994.
(27) AMBRASEYS, N. and SRBULOV, M. (1995). "Earthquake induced displacements of slopes", Soil Dynamics and Earthquake Engineering, 14, pp. 59-71.
(28) BENEDETTI D., PETRINI V. (1984). "On seismic vulnerability of masonry buildings: proposal of an evaluation procedure", L'industria delle Costruzioni; volume 18, pp. 66-78.
(29) HAAS J., KATES R., BOWDEN M. (1977). "Reconstruction following disasters", Cambridge University Press, MIT.
(30) GEIPEL R.(1979). "Friuli. Aspetti sociogeografici di una catastrofe sismica", Franco Angeli, Milano.
(31) GEIPEL R. (1991). "Long term consequences of disasters. The reconstruction of Friuli, Italy, in its international context 1976-1988", Springer Verlag, New York.
(32) COLONNA E., MOLINA C., PETRINI V. (1994). "Criteri di valutazione della vulnerabilità sismica del patrimonio edilizio esistente sul territorio nazionale", Ingegneria Sismica, volume 1 - Patron ed., pp. 16-24.
(33) A.a.V.v. (1993). "Rischio sismico di edifici pubblici", GNDT - Bologna.
(34) TERLIEN M. (1996). "Modelling spatial and temporal variations in rainfall-triggered landslides". International Institute for Aerospace Survey and Earth Sciences (ITC). The Netherlands.
(35) DURKIN M., THIEL Ch., SCHNEIDER J., DE VRIEND T., (1991). "Injuries and emergency medical respone in the Loma Prieta earthquake", in "Bulletin of the Seismological Society of America, vol. 81, n.5, Ottobre; 1991.
(36) LOSAN, (1978). "Mapa geotécnico de Barcelona, Badalona, Esplugues, L'Hospitalet, Sant Adria y Sta. Coloma", Barcelona, 32 pp, 1 map.
(37) NAKAMURA Y., (1989). "A method for dynamic characteristic estimations of subsurface using microtremors on the ground surface", QR RTRI, 30, 25-33.
(38) BARBAT A. H., YEPEZ F., CANAS J. A., (1996). "Damage scenarios simulation for seismic risk assessment in urban zones", Earthquake Spectra, 12(3), 371-394.
(39) YEPEZ F., BARBAT A. H., CANAS J. A., (1994). "Riesgo, peligrosidad y vulnerabilidad sismica de edificios de mampostería", International Center for Numerical Methods in Engeneering, CIMNE, Barcelona, monograph IS-12.
(40) YEPEZ F., BARBAT A. H., CANAS J. A., (1995). "Simulación de escenarios de dano para estudios de riesgo sísmico", International Center for Numerical Methods in Engeneering, CIMNE, Barcelona, monograph IS-14.
(41) SALTER L. (1988). "Mandated science. Science and scientists in the making of standars". Kluwer Academic Publishers, Dordrecht-Boston-London.
(42) FUNTOWICZ S. and RAVETZ J. (1990). "Uncertainty in Science for policy", Kluwer Academic Publishers, The Netherlands.
Coordinator: Dr. G. Zonno Contract:: ENV4-CT96-0279
Consiglio Nazionale delle Ricerche Start date: 01.03.96
Istituto di Ricerca sul Rischio Sismico Duration: 24 months
Via Bassini 15 Climatology and Natural Hazards
I - 20133 Milano Head of Unit: A. Ghazi
e-mail: zonno@irrs.mi.cnr.it EC Scient. Officer: M. Yeroyanni
Other Partners:
Dr. Paola CARRARA
Consiglio Nazionale delle Ricerche
Istituto per le Tecnologie Informatiche Multimediali
Via Ampère, 56
I - 20131 Milano
Dr. Mariano GARCIA-FERNANDEZ
Consejo Superior de Investigaciones Sientificas
Instituto de Ciencias de la Tierra "Jaume Almera"
Lluis Sole i Sabaris s/n
E-08028 Barcelona, Spain
Prof. Jose' A. CANAS TORRES
Universidad Politecnica de Catalunya
Departamento de Ingenieria
del Terreno y Cartografica
Gran Capitan s/n, Edificio D-2
E-08034 Barcelona, Spain
Ir. Robert SOETERS
International Institute for Aerospace
Surveys and Earth Sciences
Department of Earth Resources Surveys
350 Boulevard 1945, P.O. Box 6
NL-7500 AA Enschede, The Netherlands
Ing. Alberto CHERUBINI
S.TE.C. - INGEGNERI e
ARCHITETTI s.r.l.
Via Vittoria Colonna, 27
I - 00193 Roma, Italia
Prof. Jean-Jacques WAGNER
Université de Genève - Section des
Sciences de la Terre - Centre d'Etude
des Risques Geologiques
Rue des Maraichers, 13
CH-1211 Geneve 4, Switzerland