URBAN TEXTURE ANALYSIS
G. Ober, R. Tomasoni and F. Cella
Istituto di Ricerca sul Rischio Sismico, Via Ampère 56, 20131 Milano ITALY
ABSTRACT
The purpose of this work is the study of urban areas based on texture analysis methodology that may improve the urban investigation through remote sensing, dedicated to seismic vulnerability in correlation with the geometrical properties of building bloks and the vulnerability data, taken from field surveys. Most of the algorithms for urban classification in the image processing domain are based only on the use of spectral information, not taking into account the geometric characteristics given by the spatial distribution to roads, buildings and green areas on the image. The study of these local proprieties, as the texture, may enrich the available information on the image, providing a further information layer which may improve the differentiability among suburban areas originally belonging to homogeneous areas. In order to overcome those limitations, a new methodology, based on the analysis of connected regions, was studied. At first the image is thresholded in order to detect built pixels. Then these pixels are connected into sub-regions and these sub-regions are investigated to extract features.
Keywords: texture analysis, image processing, satellite images.
1. INTRODUCTION
The study here presented is focused on the development of a methodology based on the texture analysis of urban areas that may improve the urban investigation through remote sensing. This study can be divided in two fundamental steps: the first is to divide the pre-classified satellite image into homogeneous urban regions applying the texture analysis on the urban class. The latter is to detect and formalise the correlation between the geometrical properties of these homogeneous urban regions and their vulnerability taken from standard surveys.
The main innovative aspect introduced by this methodology regards the only use of remotely sensed images to obtain a first estimation of the urban characteristics in terms of future seismic vulnerability assessment, where no other a priori information is needed. The idea of applying texture analysis to urban areas was originated from the consideration that an urban area can be defined on the bases of urban elements. In accordance with this consideration a urban texture definition can be given as the geometrical structure formed by the spatial distribution of urban elements as buildings, roads and green areas. The main advantage offered by this methodology concerns the contribution to estimate in the near future the seismic vulnerability in regions where data are not available or where they are difficult to collect also called: vulnerability assessment with poor data. The data set used is formed by Lansat-TM and panchromatic SPOT satellite images. Landsat-TM images are used to classify urban areas and to create a urban map. The map is then overlapped on the SPOT image in order to mask only urban areas. The use of both satellite images provides the information needed to describe urban areas. Landsat-TM (ground resolution 30 m) gives the radiometric information needed to classify the image and panchromatic SPOT image gives the geometric information (ground resolution 10 m), that highlights the urban texture. Another great advantage in using satellite images is the wide area coverage of a satellite image, that is about 3600 km2 for a SPOT scene and about 36000 km2 in full scene Landsat-TM. This allows to perform the analysis over a large region that could include more than one urban centre.
In the first part of this report a brief description of the texture analysis is given; in the second one the results of the urban texture analysis are reported in detail and in the last one the second year programming is described.
2. TEXTURE ANALYSIS
The texture study is based on the analysis of the spatial distribution of ground radiance level variations, which is able to point out linear structures of a remotely sensed image, used to characterise urban morphology. To give a strict definition of texture in image processing and machine vision is not an easy task. In literature a large number of texture definitions can be found, depending on the application field [11]. It has to be highlight that most of methodology developed are strictly dependent on the texture definition, hence on the goal they are built to perform.
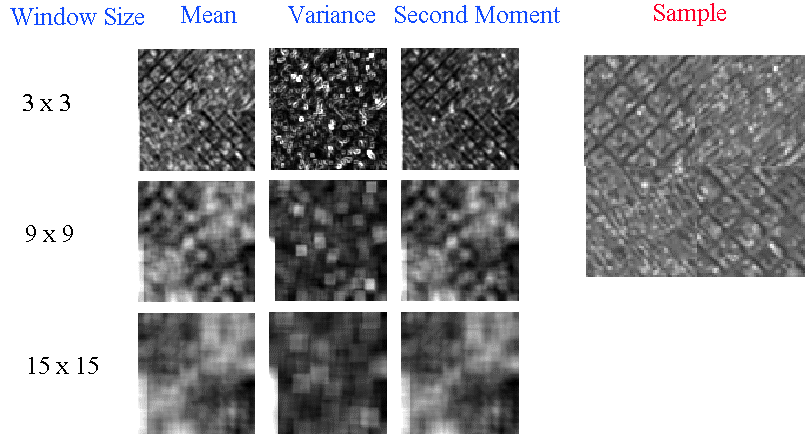
This consideration was supported when we tried to apply classical texture analysis techniques on urban areas [2] [3] [6] [7] [8]. Most of traditional methods are window based. In these methods local proprieties are extracted by computing different features within a fixed dimension window moved onto the image. These approaches strongly depend on the window dimension choice. Two limits were pointed out: bad results on texture boundaries and impossibility to define a unique window dimension over the whole image. In order to test classical techniques a synthetic texture sample of a urban centre was ad hoc created. The sample texture includes two different parts of the city with two different orientation; results are shown in figure 1.
The results obtained from the known methods weren’t acceptable for our task, hence a new methodology was studied. At first a general and useful definition of texture analysis in remote sensing, in accordance with urban texture definition, was given: The analysis of the spatial distribution of grey level variations, which is able to point out geometrical structures of an image.
In accordance with this texture definition, a window and orientation independent method was studied based on the detection of regions (or objects) surrounded by elements of separation and it is performed using the analysis of connected regions. In urban situation separator elements can be roads and connected objects can be building blocks. After having extracted all the connected regions, separator elements are assigned to the nearest connected region in order to organize the image into sub-regions. Then texture features are calculated within the detected regions to group regions with the same geometric structure. The main steps of the new algorithm can be resumed as follows:
• image thresholding in order to detect pixels related to buildings;
• the pixels representing the buildings are connected (building blocks) and the image is divided into sub-regions;
• features are extracted within these sub-regions;
• the image is classified on the basis of extracted features.
In the next paragraphs all the different phases are explained in detail.
Figure 1: First order statistic results obtained applying different fixed window size. In order to test the texture direction invariance the synthetic sample was built so that two textures are rotated with respect to each other.
2.1 IMAGE THRESHOLDING
Three different bilevel thresholding algorithms were implemented in order to separate two basic elements of the urban area: built and not-built (for example roads, railways, rivers, green areas from buildings). The first technique that has been applied is based on the minimisation of the measure of fuzziness of the image [4]. The object (pixel belonging to building) is extracted from the background (roads and other) minimising the average amount of fuzziness between the grey-level image and the binary one. The second technique applied is based on the bilevel moment-preserving thresholding [10]. The two levels of the binary image are chosen so that the new image has the same first three moments of the grey level one. The last one is based on minimising the variance of the grey level image. The image is reduced to a binary one, cutting boundary values and hence decreasing recursively the variance. In figure 2 results of the three algorithms are shown. Comparing these three approaches, a great loss of information is immediately verified applying the moment based methodology (fourth picture). On the contrary the variance minimisation based (second picture) and the fuzzy based (third picture) methods give both good results. In order to give a complete performance estimation, processing time for each algorithm has been considered, executed on a Sun SPARCstation 2. The three bilevel thresholding performed on a 1200x1100 image respectively require:
• Variance minimisation based: 3 seconds;
• Fuzzy based: 4 seconds
• Moment based: 1 minute and 7 seconds.
In accordance with the previous considerations, the moment based approach has been discarded due to the loss of information and the high processing time. The other two methods have similar performances, hence it is decided to consider both the algorithms.
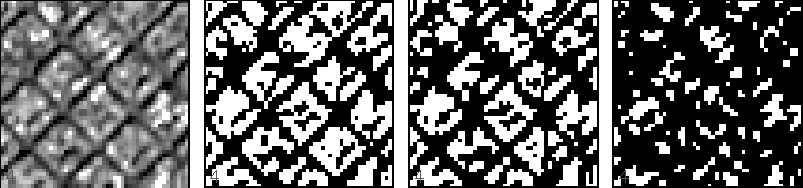
SampleVariance basedFuzzy basedMoment based
Threshold: 106 Threshold: 110 Threshold: 127
Figure 2: Comparison among three different bilevel thresholding algorithms.
2.2 CONNECTED REGIONS AND SUB-REGIONS DETECTION
The aim of this second step is to divide the image into variable size and shape sub-regions, in order to compute features able to discriminate among different sub-urban zones. This methodology overcomes the limitations of the use of a fixed window size used by the classical methods. Features extraction is computed within variable size and shape windows, based on the detection of building blocks structure. This allows the algorithm to be completely window independent.
The first phase the algorithm is dedicated to detect building blocks connecting the foreground pixels of the bilevel image [1]. To this purpose a four-connected neighbours algorithm was applied on the bilevel image and all the foreground pixels were grouped into a set of connected pixel group termed connected regions. In a second phase these building structures are inserted in the image background and sub-regions are cut.
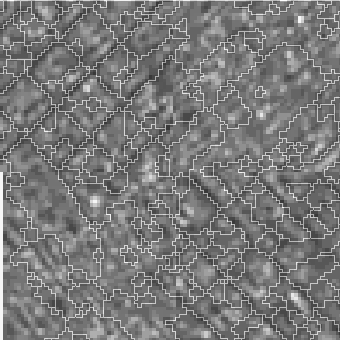
Figure 3: The white line shows the sub regions boundaries detected.
This procedure is performed assigning each image background pixel to the nearest connected regions; in this way all image pixels are associated to one of the sub-regions of the image. Shape and the dimension of the resultant sub-regions depend on the structure of the building blocks and they have not been decided a priori. An example of the result of this step is reported in figure 3.
2.3 FEATURE EXTRACTION
Although sub-regions are recognised within the bilevel image, the features are computed within the original one. At first a list of pixel positions on the bilevel image for each sub-region is compiled, then sub-regions are extracted on the grey level image on the base of this list. The feature extraction choice was not so immediate. A large number of different features are proposed in literature [2] [3] [6] [8] [9]. Many features are computed within these regions based on first order and second order statistics as, for example, entropy, mean, contrast, dissimilarity. Although these features gave not bad results, these are not considered satisfactory so ad hoc features based on the shape and dimension of the building block has been defined. These can be described as follows:
Built percentage: a ratio between sub-region area and built area is computed within each
sub-region;
Shape descriptor: a ratio between built area and the area of the minimum rectangle
including the block is computed within each sub-region;
Block dimension: area of the built block for each sub-region.
2.4 IMAGE CLASSIFICATION
Although software applied in the previous steps has been developed in our laboratory, an IsoData clustering method to perform the texture classification provided by in ENVITM 2.5, a satellite image processing tool, has been used. This choice was done to make the evaluation of the texture algorithm quicker. The classification is performed on the image obtained by the feature evaluation within each sub region. This process divides the urban area into different sub-urban zone having similar building blocks features.
3. TEXTURE APPLICATION
3.1 THE STUDY AREA
Barcelona city was chosen as study and test area in order to evaluate the results of the texture algorithm. Here a great amount of data are available, collected by Spanish partners in the EC SERGISAI project. The satellite data set used in this study is a panchromatic SPOT image of Barcelona (P45_267; K J: 45, 267; Date: 20.08.1991) and a Landsat TM image bands 3 red, 4 infrared and 5 infrared (Scene: 197-31, Date: 23.08.1990), received from the National Geographic Institute of Barcelona.
3.2 FIRST RESULT
The above methodology was applied to a spot of Barcelona city. A square 300x300 m was cut on Barcelona SPOT image and three different districts were included: Ciutat Vella, Eixample and Sant Gervasi. The texture analysis performed using built percentage feature within this spot reached good results. Three different sub-urban areas were detected, where the first one represents urban zones characterised by narrow streets and closed buildings, the second one represents regions characterised by broad streets and large-size blocks and the third one represents zones with spare buildings and large streets or squares.
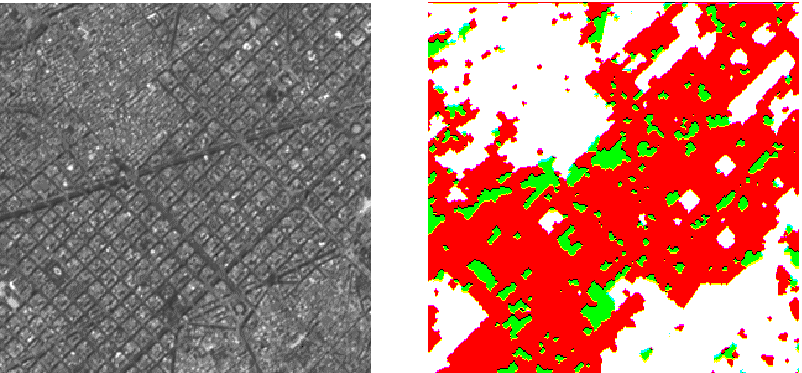
Figure 4: A sample of Barcelona SPOT image and the result of the algorithm showing three different classes.
3.3 FIRST APPLICATION
This methodology can be applied to give a further urban information layer applied to the seismic analysis, in particular when poor data are available. Texture analysis can support seismic expert in two different ways: as a first approach to decide the immediate modality of intervention in case of a seismic event and to offer an information overlay for the seismic analysis. In the first case this analysis provides a map of the urban typologies that can be used to organise a differentiated intervention on the urban area. To this purpose the output of the connected region step can be used to estimate the permeability of building blocks in case of the earthquake. This can be converted in a measure of general accessibility to the various area of the town. As example we can consider the results of the previous analysis on a spot of Barcelona city. The intervention in the two main zones can be differentiated in relation to the texture typology. It can be supposed that in case of building collapse the narrow streets and closed buildings zone will be inaccessible. For example the relief could be organised surrounding this zone. An intervention in the second main zone could be organised in a different way. Broad streets and large-size blocks allows the operator to go into in the disaster zone even in case of building collapse. The measure of accessibility to the urban area can be given as a result of the connected region step. Here connected pixels denote compact building blocks, surrounded by roads. These roads can be investigated to provide a map of roads to be run in case of seismic event. An example is shown in figure 4.
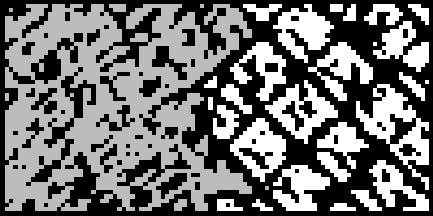
Figure 4: Example of different urban typologies.
This study can be also applied to provide information when data are not available or are poor. In this case data related to similar urban areas are used to construct information layers related to analysed one. The similarity measure can be given by the texture analysis performed on both the known and unknown zone. In next paragraph our future plan to develop this point will be explained.
4. SEISMIC VULNERABILITY DATA
5. CONCLUSIONS
Our purpose for the next year is based on the use of texture feature for urban typologies retrieval. Two possible ways are inquired: one is based on the construction of a texture image database and one in based on the features formalization in order to apply them in an expert system.
ACKNOWLEDGEMENTS
This research was in part supported by the EC Environment Research Programme, contract: ENV4-CT96-0279, Climatology and Natural Hazards.
Appendix A
The algorithm implemented to create connected pixel group is based on these definitions [1]:
4-neighbourhood set: given a co-ordinate pair (x, y), the 4-neighbourhood is defined to be the set N4(x, y)={(x+1,y),(x-1,y),(x,y+1),(x,y-1)}.
4-neighbourhood pixel: a pixel p1 at (x1, y1) is said to be 4-neighbourhood of p2 at (x2, y2) if and only if (x1, y1)ÎN4(x2,y2).
4-connected pixels: two pixels p1 and p2 are 4-connected if and only if p1 is a 4-neighbourhood of p2 and both the grey level satisfy some condition.
4-connected path: a 4-connected path between p1 and pn is a sequence of pixels such that pi, pi+1 for 1 £ i £ n-1 are 4-connected.
Four-connected region: is a set of pixels such that there is at least one 4-connecting path for each pair of pixels in this set.
REFERENCES
1 Chen Y.Q., Nixon M.S., Thomas D.W., (1995), Statistical geometrical features for texture classification, Pattern Recognition, 28(4), pp. 537-552.
2 du Buf J.M.H., Kardan M, Spann M., (1990), Texture feature performance for image segmentation, Pattern Recognition, 23(3/4), pp. 291-309.
3 Haralick R.M., Shanmugam K., Dinstein I., (1992), Texture features for image classification, IEEE Trans. Syst. Man Cybern, 3(6), pp. 610-621.
4 Huang L., Wang M.J., (1995), Image thresholding by minimizing the measure of fuzziness, Pattern Recognition, 28(1), pp. 41-51.
5 Manjunath B.S., Ma W.Y., (1996), Texture features for browsing and retrieval of image data, IEEE-PAMI, 18(8), pp. 837-842.
6 Pratt W.K., (1978), Digital image processing, Wiley-Interscience Publication, pp. 503-511.
7 Reed T.R., du Buf J.M.H., (1993), A review of recent texture segmentation and feature extraction techniques, CVGIP: Image Understanding, 57(3), pp.359-372.
8 Rosenfeld A., Kak A.C., (1976), Digital picture processing, Academic Press, pp. 418-425.
9 Sali E., Wolfson H., (1992), Texture classification in aerial photographs and satellite data, Int. J. Remote Sensing, 13(18), pp. 3395-3408.
10 Tsai W.H., (1985), Moment-preserving thresholding: a new approach, Comput. Vision Graphics Image Process, 29, pp. 377-393.
11 Tuceryan M., Jain A.K., (1994), Texture Analysis, Handbook of Pattern Recognition and Computer Vision, Eds. C.H. Chen, L.F. Pau and P.S.P Wang, World Scientific Publishing Company, pp. 235-276.
International Symposium on Optical Science Engineering and Instrumentation
27 July - 1August 1997, S. Diego, CA, USA
Program on Signal and Image Processing
Technical Conference on Application of Digital Image Processing XX